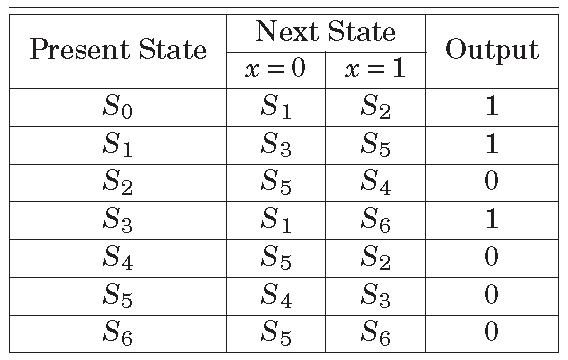
State Partition Method for State Minimization is also powerful as the Implication Chart Method and better than Row Equivalence method. In this technique, the states are partitioned into groups based on the possibility that they can be combined. Lets consider the example state table as shown in Table 1 for state minimization using state partition method. This method also perform state minimization after some passes. These passes are described below.
Start :- In the first pass there is only one group and this is  .
.
First Pass :- In the first pass, the states which have different outputs are partitioned in separate groups. Here,  ,
,  and
and  have same output and thus grouped in
  . The rest of the states have same output and thus they grouped as
  .
.
Second Pass :- In this pass, the states are partitioned based upon their  -successors. In order to combine two states, their -successors should be in the same partition or group.
Consider the first partition  and their -successors are
 -successors –
  ,
,  and
and  . Here, and belong to the same group . States , and can be combined.
 -successors –
  ,
,  and
and  . Here,
  ,
,  and
and  belong to the same group
  . States , and can be combined.
Now consider the second partition and their -successors are
- -successors –
 ,
,  ,
,  and
and  . Here,
  and belong to the same group . States , , and can be combined.
 - -successors –
 ,
,  ,
,  and
and  . Here, , and belong to group but belong to the group . Thus states , and can be combined but is a different state and it is assigned to another partition
  .
.
Third Pass :- In the third pass we have three partitions  ,
,  and
and  . Same steps are followed in this pass also.
Consider the partition and their -successors are
- -successors – The -successors are and which belong to same group.
- -successors – The -successors are , and . Here, and belong to but belong to . Thus can not be combined with and . The state is must be kept in another partition.
Similar analysis can be run for partition and .
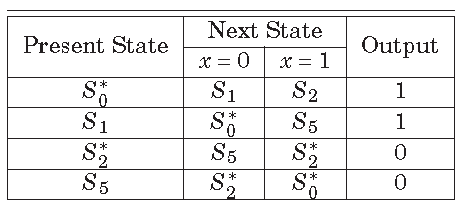
After the third pass, the partitions are updated as  ,
,  ,
,  and
and  . Further passes can be run but after the third pass there is no change in the partitions. Thus final states are same as result of the third pass. The state minimization result is same as the Implication chart produces as shown in Table 2.