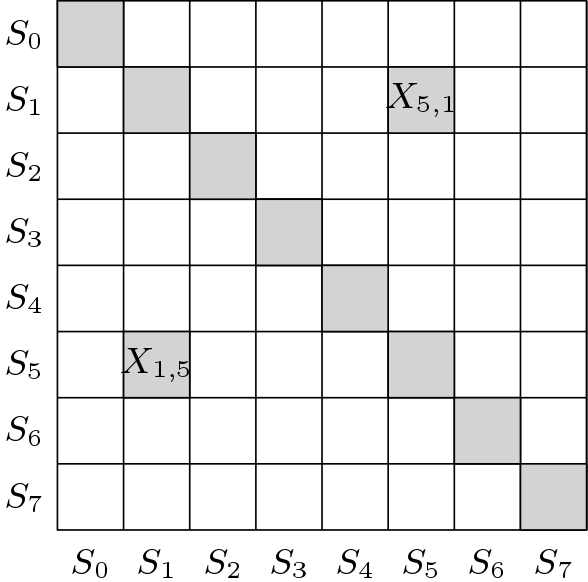
Implication Chart Method for State Minimization is very popular for reducing the steps of an FSM and it is more machine friendly method than Row Equivalence Technique. In this method, a chart is prepared to find the equivalent steps. The implication chart is shown in Figure 1. States are written along the x-axis as  ,
,  ,…,
,…, and the states are written along the y-axis in the reverse order. A square
  , contains the equivalent states between
  and
and  . The Implication Chart can be modified as
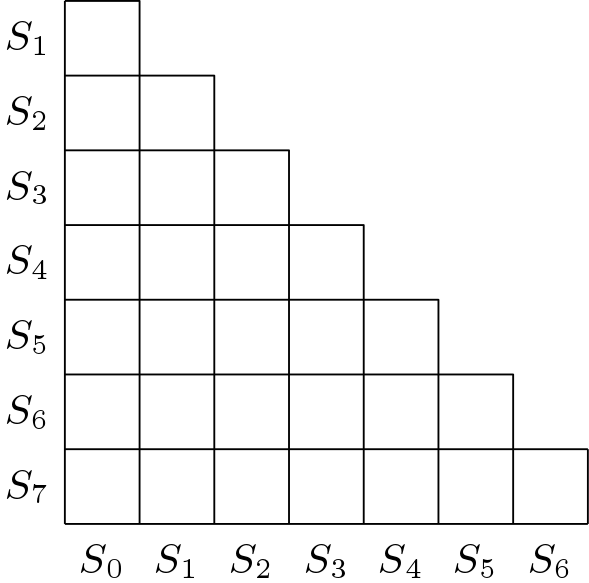
  and thus the triangle above the diagonal can be removed. Also, the diagonal can be removed as there is no sense to find equivalence to a state and itself. The reduced implication chart is shown in Figure 2.
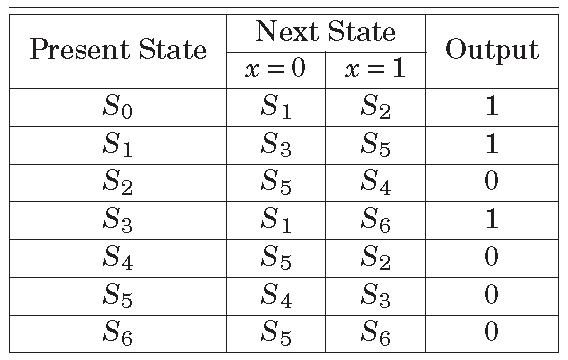
First step of Implication Chart Method for State Minimization is to fill the squares of the chart correctly. According to the state table shown in Table 1, an implication chart is shown in Figure 3. The squares are filled as by two rows. First row consists of 0-successors and the second row consists of 1-successors. In the topmost square from the left side, first row is  and the second row is
  . These pairs are called as implied state pairs. During the filling of squares, some boxes are crossed for states which can not be combined. For example,
  and can not be combined as their output is different.
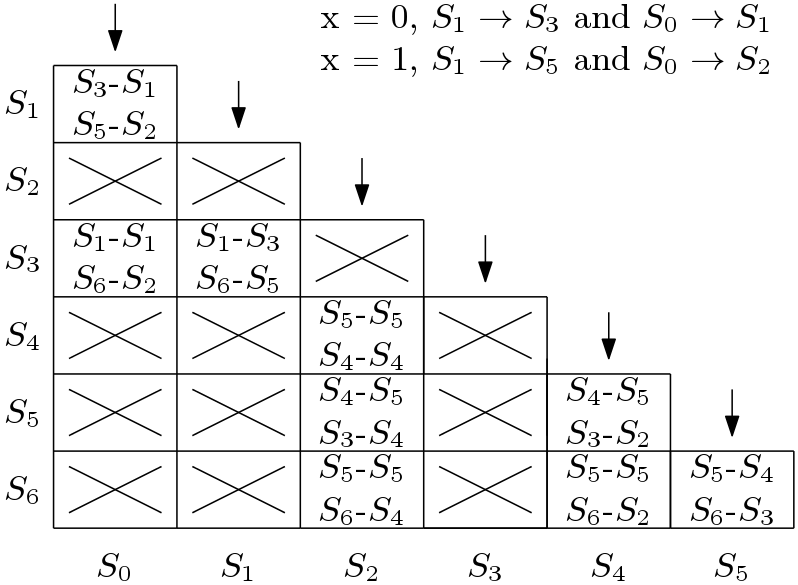
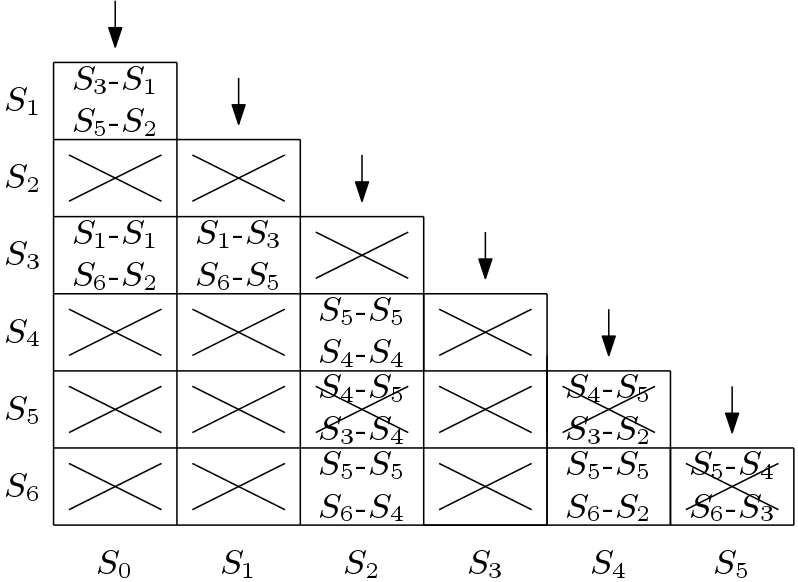
State minimization by Implication chart method is accomplished by some passes until no further combination is possible. Searching of equivalent states is done from the top to the bottom starting from the left side of the chart. The state can be combined with state or  as shown in Figure 4. But state and
  can not be combined as the square corresponding to the states and
  is marked crossed. So, the square block corresponding to and is cross marked. Similarly for the square block
  as state
  and can not be combined. At the end of the first pass it can be concluded that , and can be equivalent. Also, , and can be combined. The state can not be combined any other states.
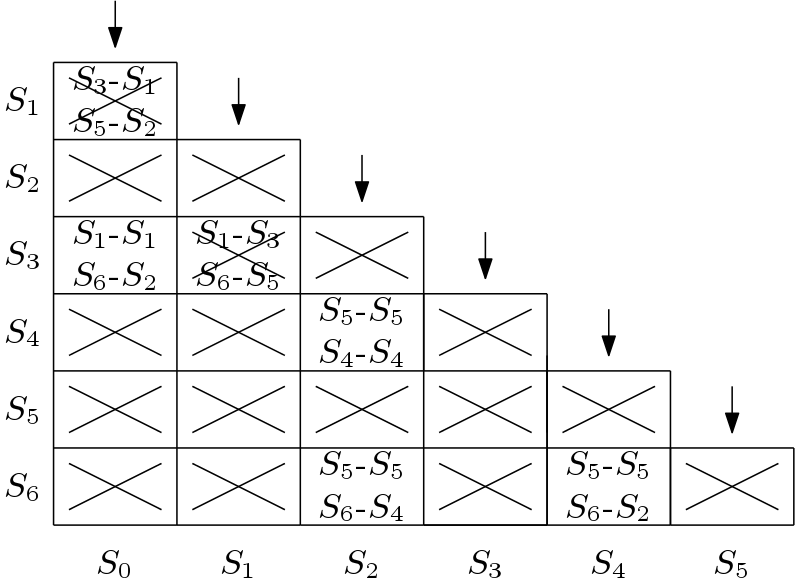
Second pass started similarly from the top to bottom starting from the left to right as shown in Figure 5. Here, the square block  is cross marked as we have seen in the earlier pass that can not be combined with . Similarly, the square block
  is cross marked because of state . After the second pass it can be concluded that and are equivalent. Also, , and are equivalent.
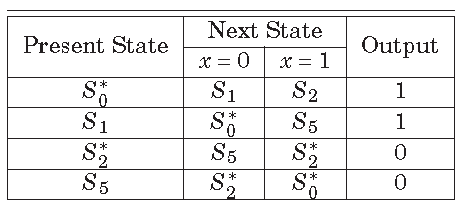
Another pass can be run but after the third pass there is no new state for reduction. Thus finally the modified state table can be formed. Here, and are combined as  . The states , and are combined as
  . The modified state table is shown below in Table 2. Here, initially there were seven states and after minimization there are now four states.